Technical Data and Influencing Factors of Carbon Monoxide Generation Under Different Combustion Conditions
1. Introduction: Starting from a Sampling Failure in a High-Pressure Combustion Chamber
Late at night during a 5MPa high-pressure combustion experiment, I sat in front of the control console, staring at the real-time readings of the NDIR (Non-Dispersive Infrared) analyzer. At the time, the objective of the experiment was to simulate the pollutant emission characteristics of an aircraft engine combustion chamber under non-stoichiometric conditions. However, an extremely peculiar phenomenon appeared in the data stream: during the smooth transition of the equivalence ratio φ from 0.95 to 1.05, the CO concentration did not exhibit a monotonically increasing trend as predicted by the kinetic model. Instead, near φ = 1.02, a violent, nonlinear pulse-like jump occurred, followed by a rapid decline.
Initially, my first reaction was a sensor malfunction. I suspected that heat loss in the sampling line under high-temperature and high-pressure conditions had caused secondary oxidation of CO, or that pressure fluctuations in the sampling probe under high-velocity turbulent flow had introduced measurement errors. To eliminate interference, I immediately checked the heating control system of the sampling line, confirming that it was maintained at a constant temperature above 250°C, far higher than the threshold for CO adsorption or chemical reaction.
However, after adjusting the sampling flow and comparing the data from in-situ laser absorption spectroscopy (TDLAS), I realized that the problem did not originate from the hardware but from the combustion physics process itself. That jump point was precisely the critical transition from "oxidation-dominated" to "reduction-dominated" in the flame core region. Under local high turbulence intensity, the concentration gradient of the gas mixture coupled with the time scale of the chemical reaction, leading to the instantaneous emergence of a local non-equilibrium state.
This experiment made me realize that studying CO generation cannot be confined solely to macroscopic thermodynamic equilibrium calculations. Thermodynamics tells us that CO₂ is a stable product at high temperatures, but kinetics tells us that in actual combustion processes, the residual CO concentration is determined by the complex interplay among radical concentration, reaction rate, and heat loss rate. If the non-equilibrium effects of the quenching zone are ignored, any emission prediction model will fail under complex operating conditions.
2. Chemical Kinetics Path Analysis of CO Formation and Oxidation
To accurately understand the fluctuations in CO concentration, it is necessary to delve into the microscopic free-radical chain reaction mechanism. During the combustion of hydrocarbons, the formation of CO is not a single step but involves a series of complex pyrolysis and oxidation intermediate processes.
2.1 Free-Radical Chain Reaction and Formation Path
In the high-temperature flame core region, the pyrolysis of fuel molecules is the source of CO formation. Taking methane (CH₄) as an example, its decomposition path follows the chain reaction below:
1. CH₄ + M → CH₃· + H· + M (Initiation step)
2. CH₃· + O₂ → CH₂O + OH· (Formaldehyde formation)
3. CH₂O + OH· → HCO· + H₂O
4. HCO· + M → CO + H· + M (Key formation step)
In this process, the decomposition of the HCO· radical is the core step determining the rate of CO formation. Due to the relatively low activation energy of this reaction, it exhibits extremely high reactivity near the flame front. Meanwhile, in the fuel-rich zone, due to insufficient oxygen supply, carbon atoms tend to enter the CO state directly via the C + O → CO pathway and cannot be further converted into CO₂.
2.2 Rate-Limiting Step of CO Oxidation
Once CO is formed, its further oxidation to CO₂ is highly dependent on the concentration of free radicals in the environment, particularly OH· and O·. In combustion kinetic modeling, the oxidation pathway of CO is primarily governed by the following two competing reactions:
(R1) CO + OH· → CO₂ + H·
(R2) CO + O· → CO₂
By comparing the Arrhenius formula k = A exp(-Ea/RT), it can be seen that the activation energy Ea of reaction (R1) is generally lower than that of (R2). This means that in actual combustion processes, the concentration of OH· radicals is the "bottleneck" controlling the CO oxidation rate. Under lean-burn conditions, due to abundant O₂, the OH· concentration generated via H + O₂ → OH + O is extremely high, allowing CO to be rapidly oxidized. However, in fuel-rich or rapidly quenched zones, the sharp drop in OH· concentration severely inhibits the oxidation kinetics of CO, resulting in high residual CO concentrations.
2.3 Non-Equilibrium State and Chemical Time Scales
In engineering applications, we often face a core contradiction: the matching between the chemical reaction time scale (τ_chem) and the fluid residence time (τ_flow).
When the temperature at the flame edge drops rapidly due to heat loss, the reaction rate k decreases exponentially. If the cooling rate exceeds the CO oxidation rate, i.e., τ_chem > τ_flow, the chemical reaction undergoes "freezing". At this point, the system deviates from thermodynamic equilibrium, and the CO that would have been converted to CO₂ under equilibrium conditions becomes "locked" within the gas mixture. The CO concentration in this non-equilibrium state is far higher than the theoretical value calculated based on thermodynamic equilibrium.
3. Quantitative Analysis of Combustion Variables on CO Concentration
3.1 Nonlinear Effect of Equivalence Ratio φ
The equivalence ratio φ is the core parameter determining the combustion stoichiometric state. Under lean-burn conditions (φ < 1), excess oxygen ensures an abundant supply of OH· and O· radicals. However, as φ approaches the stoichiometric ratio (φ = 1), the decrease in oxygen concentration leads to a reduction in radical concentration, and the CO oxidation rate begins to exhibit significant lag.
The most critical nonlinear transition occurs when crossing the stoichiometric ratio into the fuel-rich zone (φ > 1). At this point, oxygen deficiency shifts the reaction environment from "oxidation-limited" to "fuel-limited". The CO formation rate increases exponentially, while its oxidation rate declines sharply due to the depletion of radical concentrations.
Table 1: CO Concentration Evolution Data at Different Equivalence Ratios φ (Simulated Values)
| Equivalence Ratio φ | Theoretical Temperature T (K) | CO Concentration C_CO (vol%) | Concentration Growth Multiple (Relative to φ=1) |
|---|---|---|---|
| 0.80 | 1820 | 0.005 | - |
| 0.90 | 1850 | 0.04 | 5.0 |
| 0.95 | 1840 | 0.15 | 18.7 |
| 1.00 | 1800 | 0.85 | 106.2 |
| 1.05 | 1760 | 4.20 | 525.0 |
| 1.10 | 1710 | 18.50 | 2312.5 |
| 1.20 | 1620 | 55.00 | 6875.0 |
From the table, it can be observed that in the extremely narrow range from φ = 1.0 to φ = 1.1, the CO concentration undergoes an order-of-magnitude jump. This nonlinear characteristic originates from the combined effect of the cliff-like drop in oxygen supply and the pyrolysis rate of hydrocarbons.
3.2 Disturbance of Temperature Field on CO/CO₂ Equilibrium
Temperature not only determines the thermal efficiency of combustion but also directly controls the oxidation kinetics through the Arrhenius relationship. According to the reaction rate equation k = A exp(-Ea/RT), the rate of CO oxidation is extremely sensitive to temperature variations.
In the high-temperature region, although thermodynamic equilibrium predicts a very low CO concentration, the extremely fast reaction rate allows the system to remain relatively close to equilibrium. However, in the cooling zone at the combustor exit or the quenching zone at the flame edge, the temperature drops rapidly. Due to the presence of Ea, a small decrease in temperature leads to a drastic reduction in the rate constant k.
We often observe a phenomenon called "kinetic freezing": the actual measured CO concentration C_CO,actual is often far higher than the thermodynamic equilibrium prediction C_CO,eq. The degree of deviation can be expressed by the following formula:
ΔC_CO = C_CO,actual - C_CO,eq ∝ exp(Ea/R · (1/T_quench - 1/T_eq))
3.3 Influence of Fuel Composition and Carbon-to-Hydrogen Ratio (C/H Ratio)
The chemical structure of the fuel directly influences the baseline CO generation by altering the pyrolysis pathway and the distribution of intermediate products.
For methane (CH₄, C/H=0.25), with its simple molecular structure, a relatively high concentration of H· radicals is produced during pyrolysis, which promotes CO oxidation to a certain extent. In contrast, for propane (C₃H₈, C/H=0.375) or biomass surrogate fuels with a higher C/H ratio, the situation is completely different:
1. Bond energy differences: Long-chain hydrocarbons contain more C-C bonds, and their cleavage produces a higher concentration of carbon-based radicals.
2. Complex pyrolysis pathways: High C/H fuels generate a large number of aromatic hydrocarbon intermediates during pyrolysis. The fragmentation of these structures produces a large quantity of stable CO cores, and due to the relative scarcity of oxygen atoms, this CO is difficult to oxidize in a short time.
3. Radical dilution effect: High-carbon fuels produce relatively less H₂O during combustion, thereby reducing the concentration of OH· radicals in the environment and further worsening the CO oxidation environment.
4. Practical Case Study: Abnormal CO Fluctuations in an Industrial Burner Under Non-Stoichiometric Conditions
During a field test of a natural gas industrial burner, we encountered a highly challenging engineering problem. The burner was designed to operate at a working pressure of 0.1 MPa, but during actual operation, pressure fluctuations in the upstream gas supply system (±5%) caused extremely irregular pulsed fluctuations in the observed CO emissions.
4.1 Experimental Phenomena and Data Recording
During the pressure fluctuations, although the control system attempted to maintain φ = 1.0 by adjusting the air-fuel ratio, the flue gas analyzer displayed CO concentrations that violently jumped between 100–2000 ppm. To investigate the cause, we installed high-frequency pressure sensors and infrared thermometers at critical cross-sections of the combustion chamber and recorded the following data:
Table 2: Combustion Characteristic Observation Data Under Pressure Fluctuation Conditions (Simulated Values)
| Pressure P (MPa) | Equivalence Ratio φ | Flame Temperature T (K) | CO Concentration C_CO (ppm) | Remarks |
|---|---|---|---|---|
| 0.100 | 1.00 | 1850 | 150 | Stable condition |
| 0.105 | 1.01 | 1830 | 220 | Pressure rise, mixing improved |
| 0.095 | 0.99 | 1845 | 850 | Pressure drop, local lean burn |
| 0.100 | 1.02 | 1810 | 1850 | Pressure fluctuation triggers turbulence transition |
| 0.110 | 1.05 | 1780 | 4500 | Excessive pressure, mixing lag |
| 0.090 | 0.95 | 1860 | 3200 | Low pressure, local fuel-rich zone |
4.2 Data Correlation Analysis: Mixing Intensity and Chemical Time Scale
Through in-depth analysis of Table 2, the core of the problem lies in the mismatch between the mixing time scale (τ_mix) induced by pressure fluctuations and the chemical reaction time scale (τ_chem).
During a sudden pressure drop (e.g., P=0.090 MPa), the local Reynolds number inside the burner changes, leading to a reduction in turbulence intensity. This extends the average time required for fuel-air mixing, τ_mix. When τ_mix > τ_chem, the flame front encounters locally unmixed fuel-rich pockets.
Inside these microscopic pockets, the local equivalence ratio φ_local may already be as high as 1.3 or more, even though the macroscopic sensor monitors a φ of only 0.95. The CO concentration generated in these local fuel-rich zones is extremely high, and due to local heat loss caused by uneven mixing, this CO cannot be completely oxidized within the flame residence time, ultimately entering the exhaust passage.
4.3 Engineering Conclusions and Improvement Suggestions
Simply adjusting the gain of the air-fuel ratio controller to cope with pressure fluctuations is futile, because it is a control method based on "average values".
Technical recommendations are as follows:
1. Enhanced mixing perturbation: By optimizing the nozzle geometry (e.g., introducing a Swirler), high-intensity turbulence is forcibly maintained within the range of pressure fluctuations, shortening τ_mix and ensuring τ_mix ≪ τ_chem.
2. Pressure compensation control: Introduce pressure feedforward compensation into the control loop. At the instant a pressure fluctuation occurs, pre-judge and finely adjust the secondary air flow to offset the effect of local mixing lag.
3. Residence time optimization: Appropriately extend the residence time in the flame core region to provide a sufficient kinetic window for CO oxidation in the local fuel-rich zones.
5. Technical Insights: CO Control Strategies for Complex Operating Conditions
Faced with increasingly stringent emission standards and complex unsteady-state operating conditions, traditional feedback control based on empirical models has reached its limit. Future control logic must shift from "responsive regulation" to "kinetics-aware active control".
5.1 Control Criterion Based on the Damköhler Number
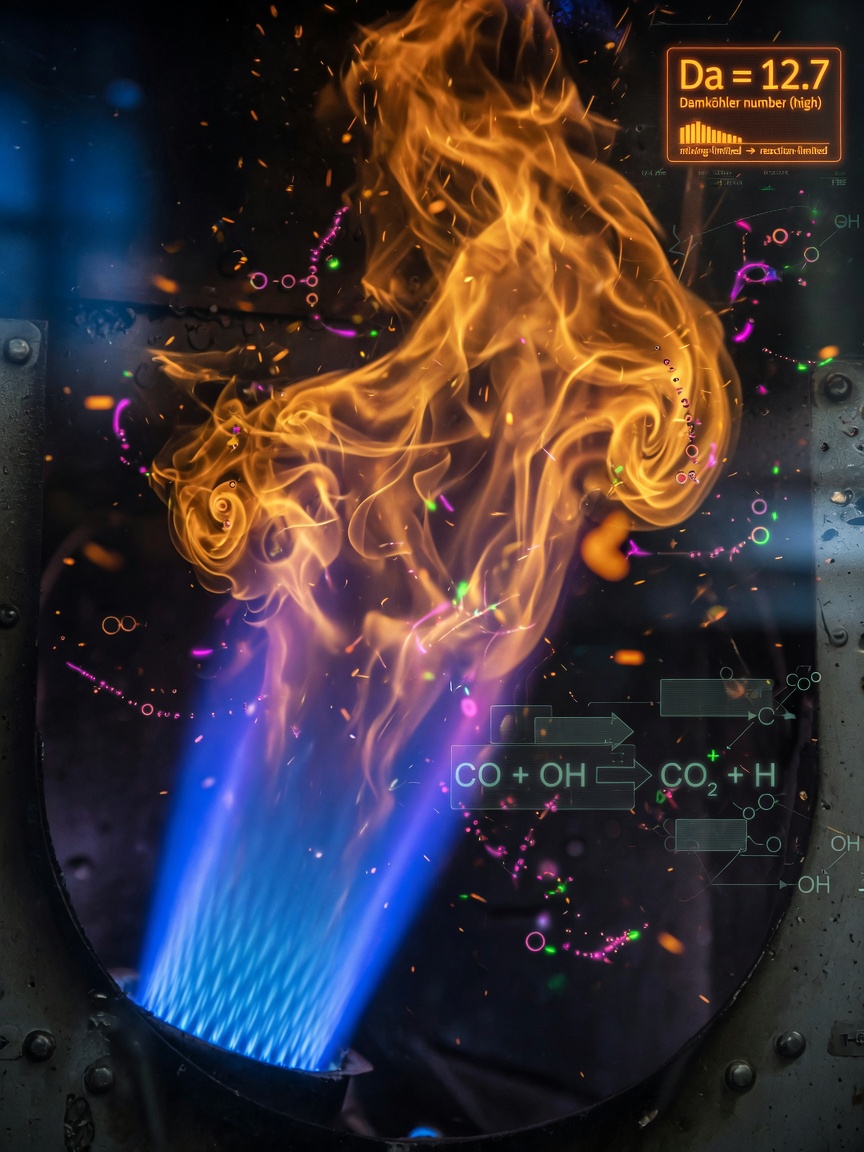
When designing combustion systems, the Damköhler number (Da) should be adopted as the core design criterion:
Da = τ_flow / τ_chem
When Da ≪ 1, the chemical reaction is limited by the mixing rate, and CO emissions will exhibit unpredictable non-equilibrium characteristics. The design goal of high-performance burners should be to maintain the system in a stable regime where Da ≫ 1, by optimizing the turbulence structure and thermodynamic pathways, ensuring that the chemical reaction can track flow field variations in real time.
5.2 Real-Time Free Radical Monitoring and TDLAS Integration
Traditional NDIR sensors can only measure macroscopic products and cannot sense the reaction process. Future intelligent combustion systems should integrate high-frequency tunable diode laser absorption spectroscopy (TDLAS) technology to monitor the concentrations of OH· and CH· radicals in the flame core region in real time. By monitoring fluctuations in the concentration of these key radicals, the system can anticipate trends of chemical kinetic imbalance and compensate through microsecond-level adjustments of secondary air flow before the CO concentration actually jumps.
5.3 Real-Time Prediction Using Physics-Informed Neural Networks (PINNs)
For complex chemical source terms in non-equilibrium states, traditional CFD calculations are too computationally intensive to meet real-time control requirements. Introducing Physics-Informed Neural Networks (PINNs) is a highly promising direction. By incorporating the partial differential equations of combustion chemistry (such as the Navier-Stokes equations and chemical kinetic equations) as part of the loss function, PINNs can achieve real-time, high-precision prediction of local non-equilibrium CO concentrations. This dual-driven "model + data" approach will evolve combustion control from simple proportional-integral-derivative (PID) logic into an intelligent decision-making system with "chemical perception".
5.4 Active Turbulence Control Technology
For extremely high-pressure or extremely high-velocity conditions, using plasma actuators or high-frequency pulsed injection technology for active turbulence control is a physical means to solve the mixing lag problem. By introducing high-frequency perturbations at the flame root, the turbulence scale can be artificially reshaped, forcibly shortening the mixing time scale τ_mix, thereby eliminating CO emission pulses caused by local fuel-rich pockets at the physical level.
Key Parameters
Comparison: Stable vs. Fluctuating Conditions
✅ Stable Condition
- Equivalence ratio φ = 1.00
- Pressure P = 0.100 MPa
- Flame temperature T = 1850 K
- CO concentration C_CO = 150 ppm
⚠️ Fluctuating Condition
- Equivalence ratio φ = 1.02
- Pressure P = 0.100 MPa (fluctuating)
- Flame temperature T = 1810 K
- CO concentration C_CO = 1850 ppm